10 Introduction to Simulation
A probability model of a random phenomenon consists of a sample space of possible outcomes, associated events and random variables, and a probability measure which encapsulates the model assumptions and determines probabilities of events and distributions of random variables. We will study strategies for computing probabilities, distributions, expected values, and more, but in many situations explicit computation is difficult. Simulation provides a powerful tool for working with probability models and solving complex problems.
- Simulation involves using a probability model to artificially recreate a random phenomenon, many times, usually using a computer.
- Given a probability model, we can simulate outcomes, occurrences of events, and values of random variables, according to the specifications of the probability measure which reflects the model assumptions.
- In general, a simulation involves the following steps.
- Set up. Define a probability space, and related random variables and events.
- Simulate. Simulate — according to the assumptions reflected in the probability measure — outcomes, occurrences of events, and values of random variables.
- Summarize. Summarize simulation output in plots and summary statistics (relative frequencies, averages, standard deviations, correlations, etc) to describe and approximate probabilities, distributions, and related characteristics.
- Sensitivity analysis. Investigate how results respond to changes in the assumptions or parameters of the simulation.
- Many random phenomena can be concretely represented in terms of “box models” and “spinners”.
Example 10.1 Consider rolling a four-sided die.
- Set up a box model for simulating a roll of a fair four-sided die. Then set up a spinner. Suppose you spin this spinner many times. Sketch a plot of the simulated values.
- Set up a box model for simulating a roll of a die that lands on 1, 2, 3, 4, with respective probability 0.1, 0.2, 0.3, 0.4. Then set up a spinner. Suppose you spin this spinner many times. Sketch a plot of the simulated values.
Example 10.2 Consider the meeting problem.
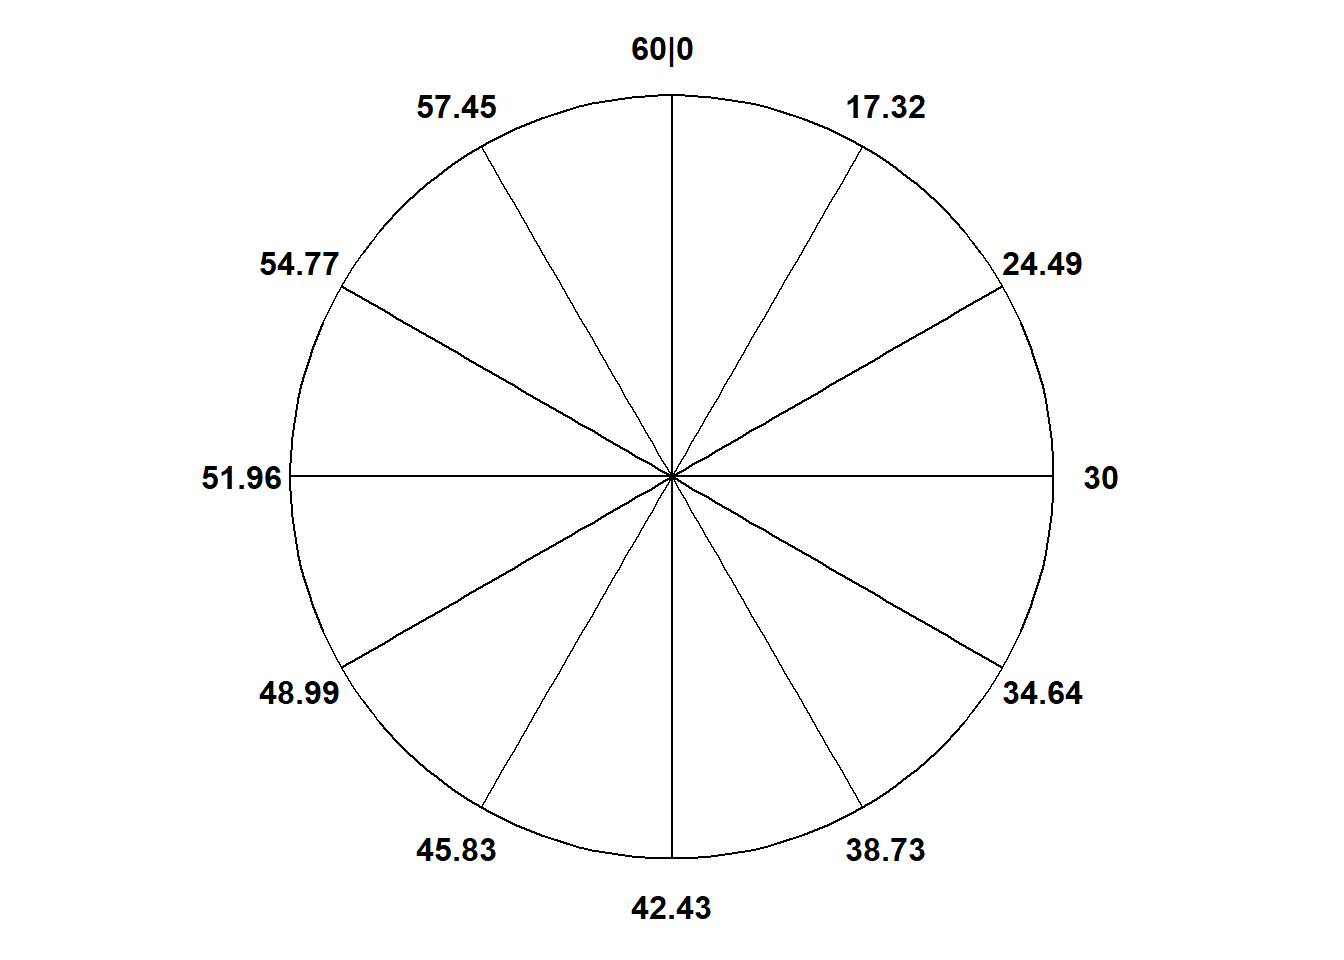
- Suppose Regina arrives uniformly at random in the continuous time interval between noon and 1:00 (that is, between 0 and 60 minutes after noon). Construct a circular spinner to simulate Regina’s arrival time. In particular, what values go at the “3 o’clock”, “6 o’clock”, and “9 o’clock” points on the spinner’s axis? (Here “3 o’clock” refers to the direction on the “clock” (spinner), one quarter of the way around, and not arrival time.) Suppose you spin this spinner many times. Sketch a histogram of the simulated arrival times.
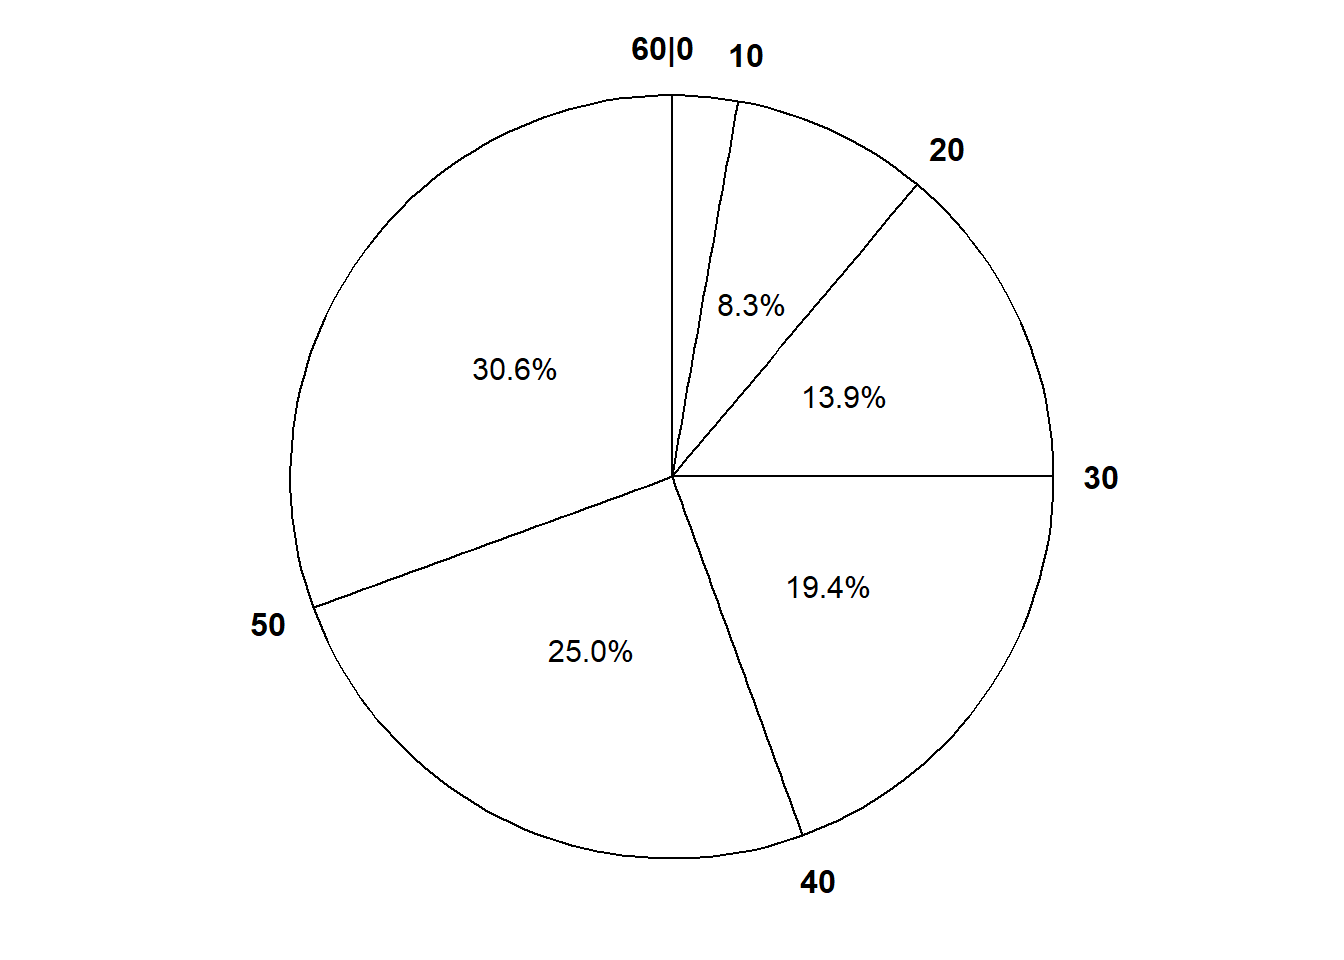
- Suppose you use the following spinner to simulate Han’s arrival time. Suppose you spin this spinner many times. Sketch a histogram of the simulated arrival times. Roughly what does such a model assume about Han’s arrival time?
Suppose that Cady has a probability of 0.25 of arriving in each of the intervals \([0, 23]\), \([23, 30]\), \([30, 37]\), \([37, 60]\). Also assume that Cady has a probability of (roughly):
- 0.025 of arriving in the interval \([0, 10]\)
- 0.135 of arriving in the interval \([10, 20]\)
- 0.135 of arriving in the interval \([40, 50]\)
- 0.025 of arriving in the interval \([50, 60]\)
Sketch a spinner for simulating Cady’s arrival time. Suppose you spin this spinner many times. Sketch a histogram of the simulated arrival times. Roughly what does such a model assume about Cady’s arrival time?
Now suppose Regina, Han, and Cady arrive independently of each other, according to the assumptions in the previous parts. Let \(T\) (minutes after noon) be the time of the first arrival, and let \(W\) be the amount of time (minutes) the first to arrive waits for the last to arrive. Explain how you can use simulation to approximate the joint and marginal distributions of \(T\) and \(W\).
Example 10.3 Suppose that
- 65% of American adults age 18-29 use Snapchat
- 24% of American adults age 30-49 use Snapchat
- 12% of American adults age 50-64 use Snapchat
- 2% of American adults age 65+ use Snapchat
Also suppose that
- 20% of American adults are age 18-29
- 33% of American adults are age 30-49
- 25% of American adults are age 50-64
- 22% of American adults are age 65+
Consider simulating a randomly selected U.S. adult and determining the person’s age group and whether or not they use Snapchat.
- How could you perform one repetition of the simulation using spinners based solely on the percentages provided above, without first computing any other probabilities? (Hint: you’ll need a few spinners, but you might not spin them all in a single repetition.)
- How could you perform one repetitionof the simulation using just a single spinner? (Hint: You’ll need to compute some probabilities first.)