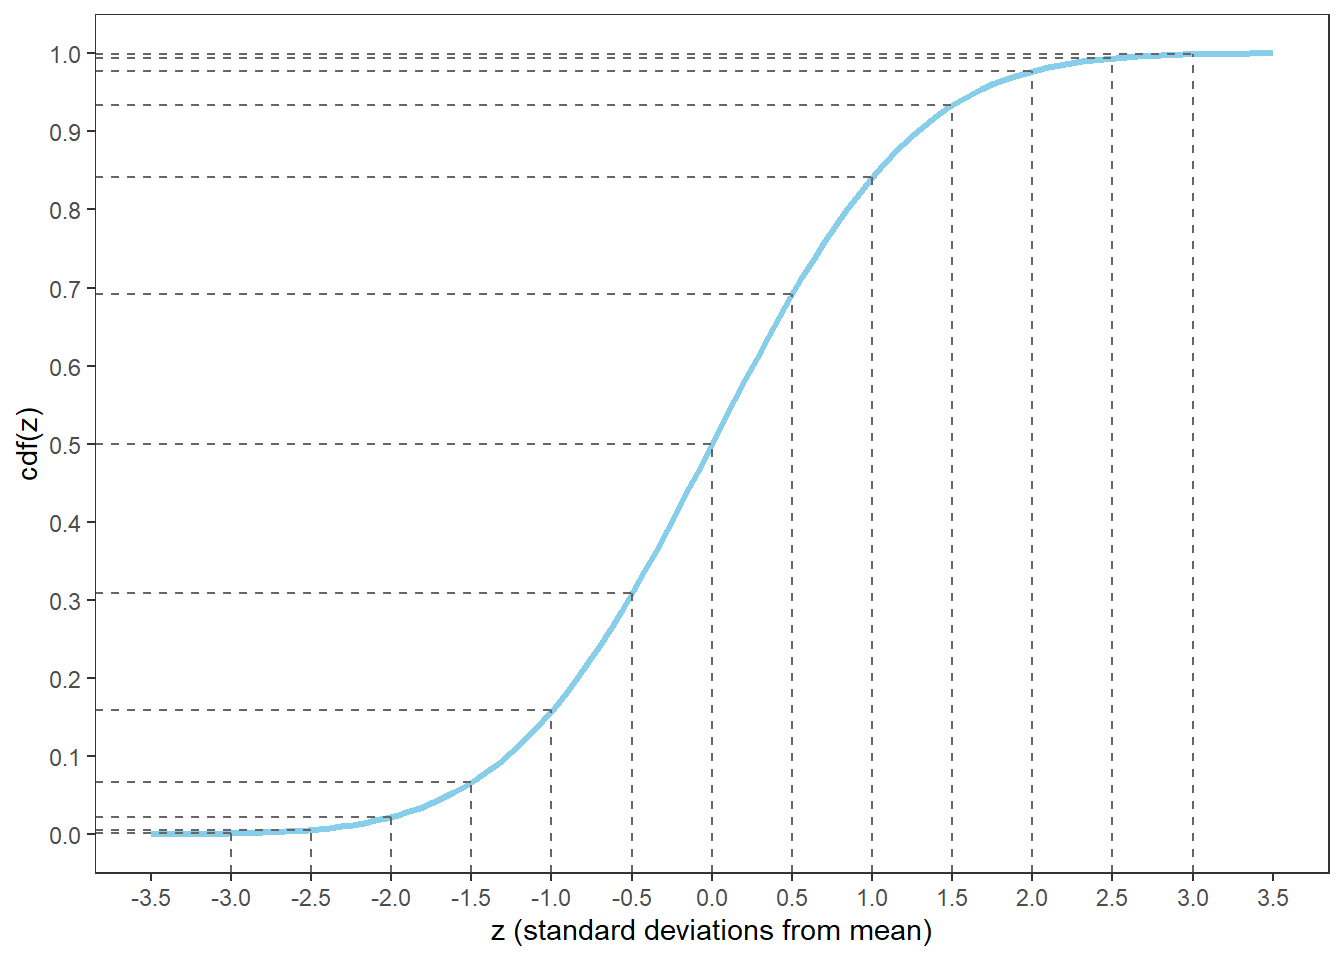
Percentiles for Normal Distributions (Empirical Rule)
| Percentile | Standard deviations from the mean |
|---|---|
| 0.02% | -3.5 |
| 0.1% | -3.0 |
| 0.6% | -2.5 |
| 2.3% | -2.0 |
| 6.7% | -1.5 |
| 15.9% | -1.0 |
| 30.9% | -0.5 |
| 50% | 0.0 |
| 69.1% | 0.5 |
| 84.1% | 1.0 |
| 93.3% | 1.5 |
| 97.7% | 2.0 |
| 99.4% | 2.5 |
| 99.9% | 3.0 |
| 99.98% | 3.5 |
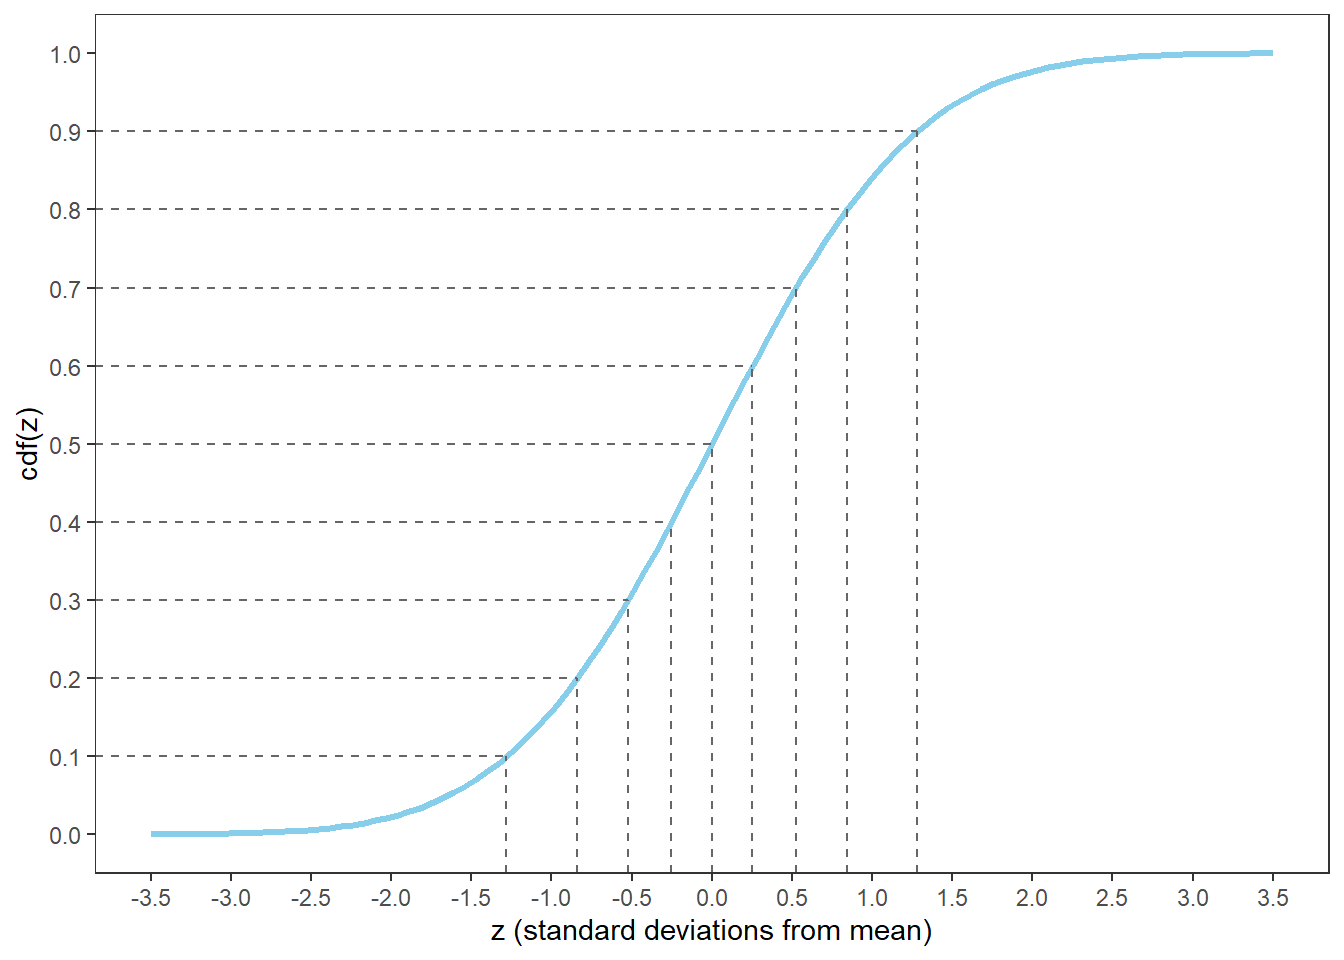
| Percentile | Standard deviations from the mean |
|---|---|
| 1% | -2.33 |
| 5% | -1.64 |
| 10% | -1.28 |
| 20% | -0.84 |
| 25% | -0.67 |
| 30% | -0.52 |
| 40% | -0.25 |
| 50% | 0.00 |
| 60% | 0.25 |
| 70% | 0.52 |
| 75% | 0.67 |
| 80% | 0.84 |
| 90% | 1.28 |
| 95% | 1.64 |
| 99% | 2.33 |
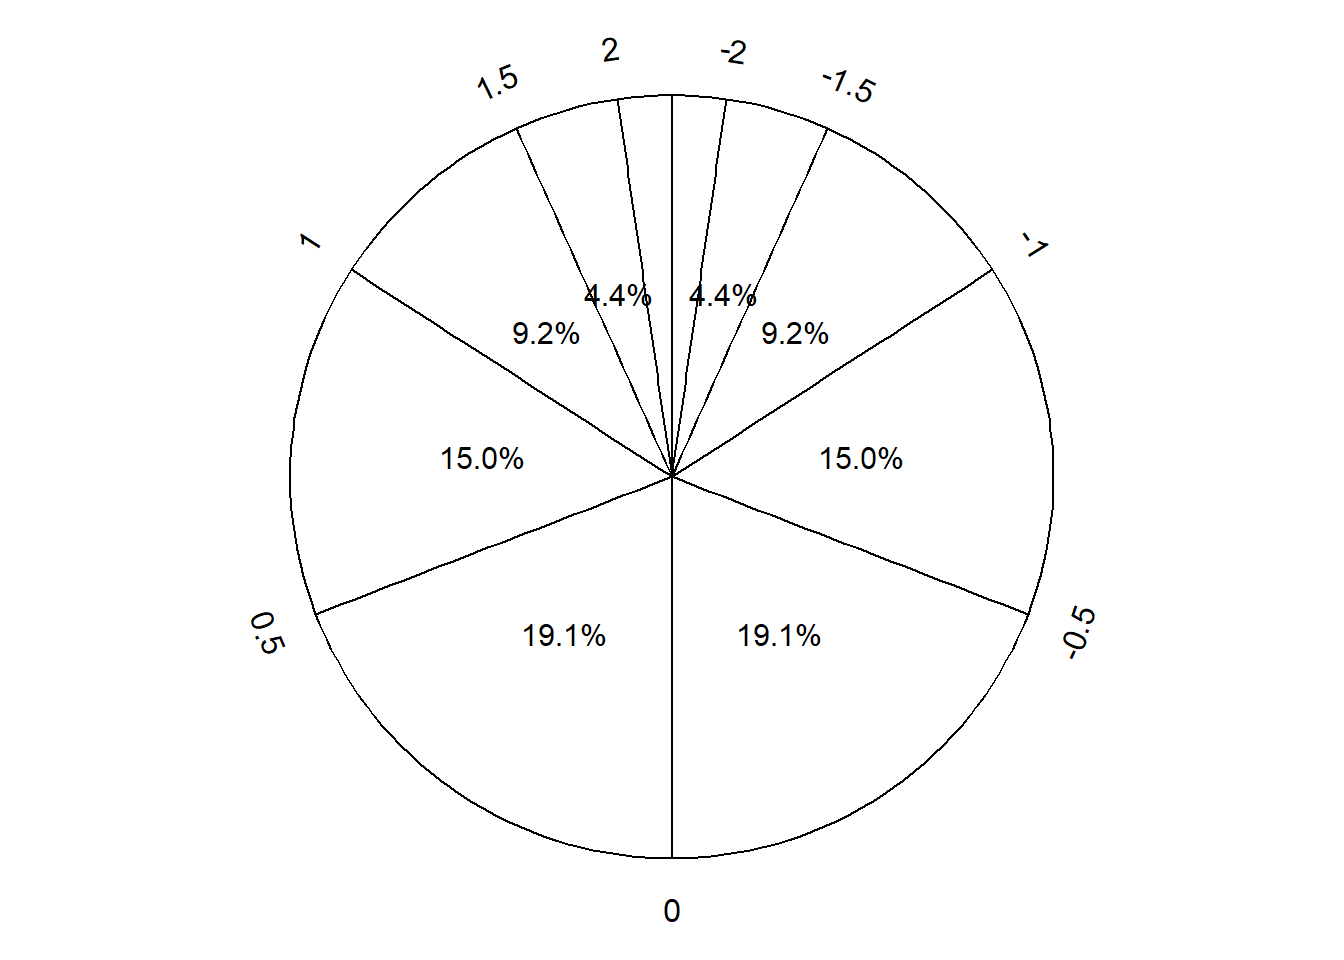
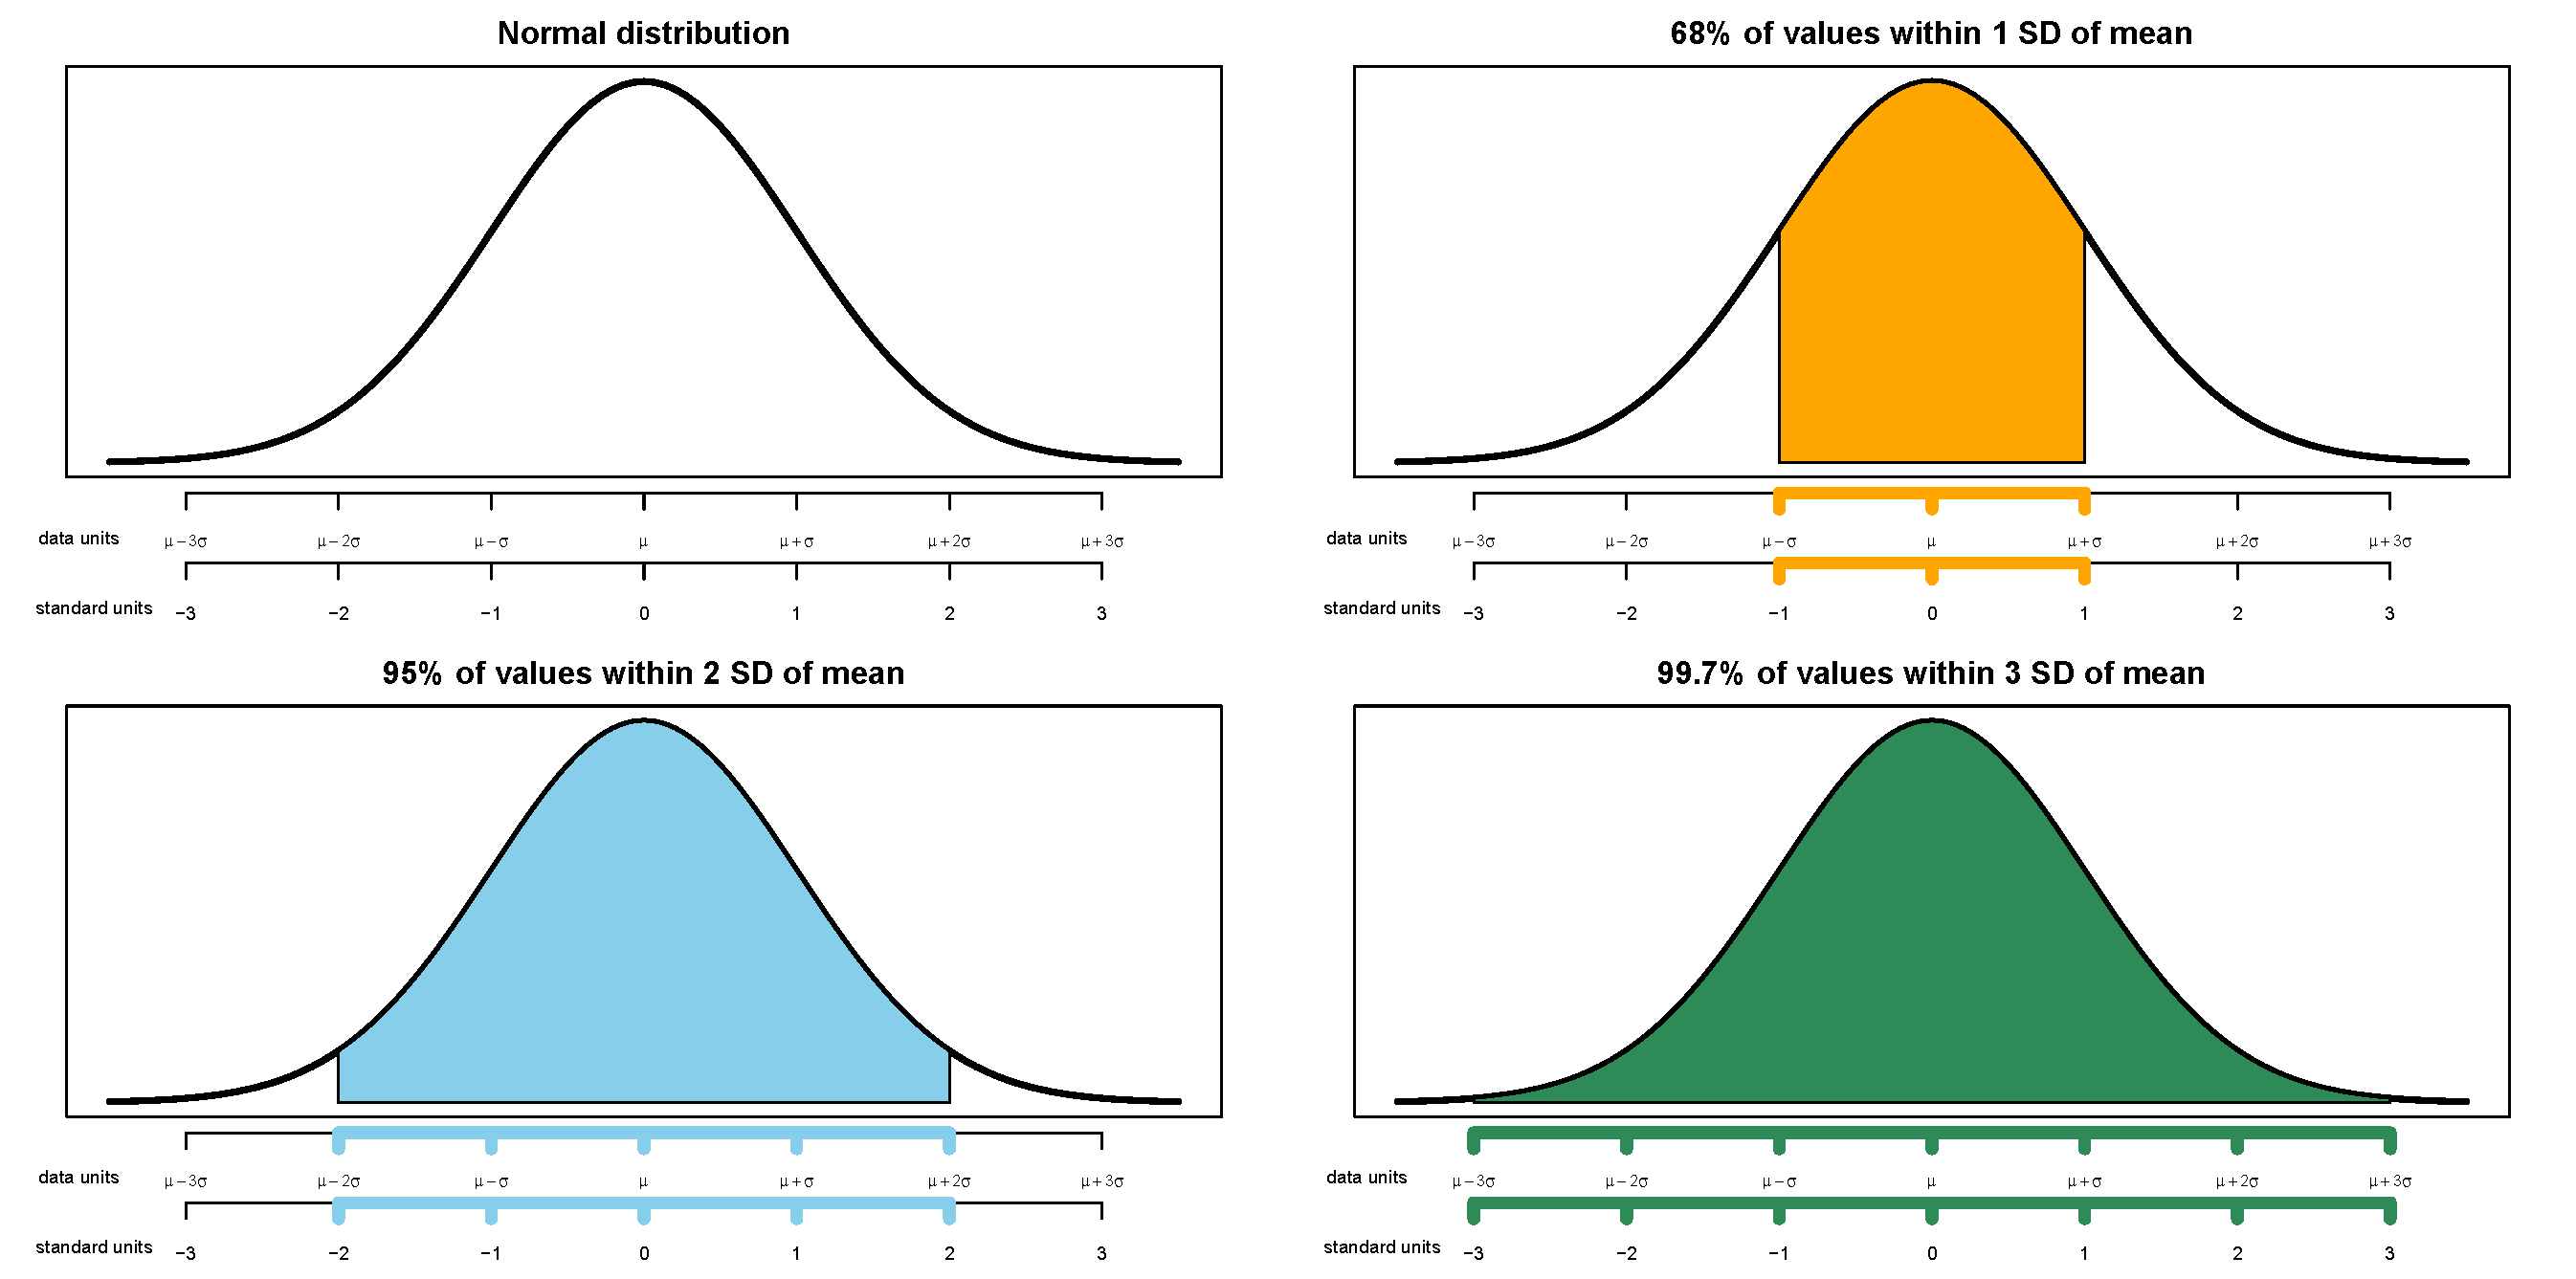
The empirical rule is often described in terms of “within [blank] standard deviations of the mean” as in the following:
- 38% of values are within 0.5 standard deviations of the mean
- 50% of values are withing 0.67 standard deviations of the mean
- 68% of values are within 1 standard deviation of the mean
- 87% of values are within 1.5 standard deviations of the mean
- 95% of values are within 2 standard deviations of the mean
- 99% of values are within 2.6 standard deviations of the mean
- 99.7% of values are within 3 standard deviations of the mean
- 99.99% of values are within 4 standard deviations of the mean