13 Variance and Standard Deviation
The values of a random variable vary. The distribution of a random variable describes its pattern of variability. The expected value of a random variable summarizes the distribution in just a single number, the long run average value. But the expected value does not tell us much about the degree of variability of the random variable. Do the values of the random variable tend to be close to the expected value, or are they spread out? Variance and standard deviation are numbers that address these questions.
Example 13.1 Let \(X\) be a random variable with a Uniform(0, 60) distribution (like we have seen in the meeting problem).
- Sketch a histogram of many simulated values of \(X\).
- Explain how you could use simulation to approximate \(\text{E}(X)\). What do you think the value of \(\text{E}(X)\) is for this \(X\)?
- Explain how we could use simulation to approximate \(\text{E}(|X - \text{E}(X)|)\). Why might we consider this quantity as a measure of variability? What do you think the value of \(\text{E}(|X - \text{E}(X)|)\) is for this \(X\)?
- The variance of \(X\) is defined as \(\text{Var}(X) = \text{E}(|X - \text{E}(X)|^2)\). Explain how you could use simulation to approximate \(\text{E}(|X - \text{E}(X)|^2)\). Why might we consider variance as a measure of variability?
- The standard deviation of \(X\) is defined as \(\text{SD}(X) = \sqrt{\text{Var}(X)}\). Explain why we take the square root. Hint: consider measurement units, e.g., if \(X\) is measured in minutes what are the measurement units of variance and standard deviation? Why might we consider standard deviation as a measure of variability?
- Is \(\text{SD}(X)\) equal to \(\text{E}(|X - \text{E}(X)|)\)? Why or why not?
- Explain how we can use simulation to approximate \(\text{E}(X^2)\). Is it equal to \(\text{E}(X)^2\)?
- Use simulation to approximate \(\text{E}(X^2) - \text{E}(X)^2\). What do you notice?
- The variance of a random variable \(X\) is \[\begin{align*} \text{Var}(X) & = \text{E}\left(\left(X-\text{E}(X)\right)^2\right)\\ & = \text{E}\left(X^2\right) - \left(\text{E}(X)\right)^2 \end{align*}\]
- The standard deviation of a random variable is \[ \text{SD}(X) = \sqrt{\text{Var}(X)} \]
- Variance is the long run average squared deviation from the mean.
- Standard deviation measures, roughly, the long run average distance from the mean. The measurement units of the standard deviation are the same as for the random variable itself.
- The definition \(\text{E}((X-\text{E}(X))^2)\) represents the concept of variance. However, variance is usually computed using the following equivalent but slightly simpler formula. \[ \text{Var}(X) = \text{E}\left(X^2\right) - \left(\text{E}\left(X\right)\right)^2 \]
- That is, variance is the expected value of the square of \(X\) minus the square of the expected value of \(X\).
- In some cases, we have the expected value and variance and we want to compute \(\text{E}(X^2)\). Rearranging the above formula yields \[ \text{E}\left(X^2\right) = \text{Var}(X) + \left(\text{E}\left(X\right)\right)^2 \]
- Variance has many nice theoretical properties (which we’ll see later). Whenever you need to compute a standard deviation, first find the variance and then take the square root at the end.
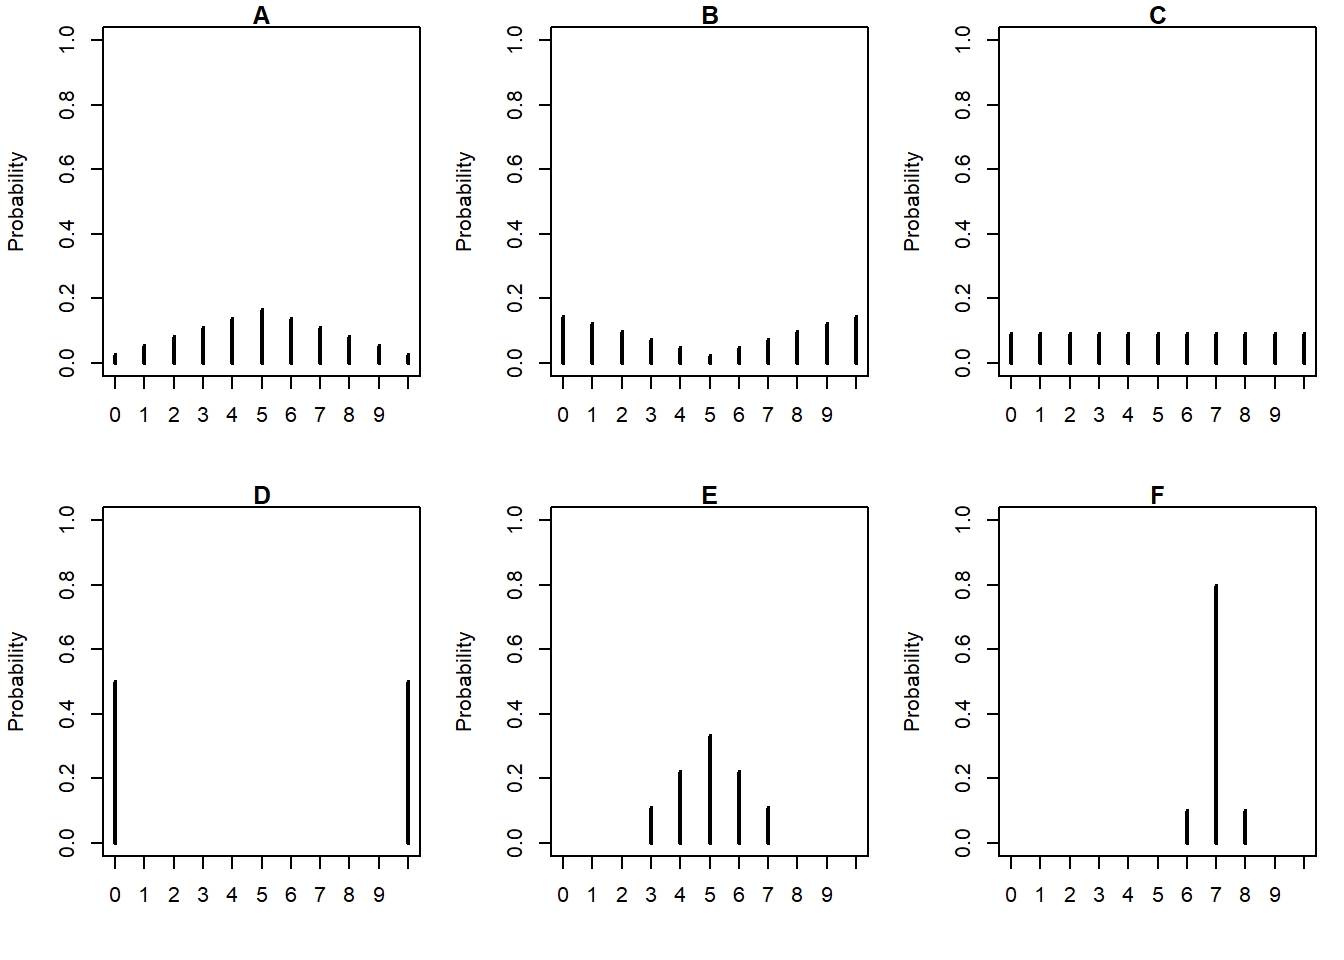
Example 13.2 The plots below summarize hypothetical distributions of quiz scores in six classes. All plots are on the same scale. Each quiz score is a whole number between 0 and 10 inclusive.
- Donny Dont says that C represents the smallest SD, since there is no variability in the heights of the bars. Do you agree that C represents “no variability? Explain.
- What is the smallest possible value the SD of quiz scores could be? What would need to be true about the distribution for this to happen? (This scenario might not be represented by one the plots.)
- Without doing any calculations, arrange the classes in order based on their SDs from smallest to largest.
- In one of the classes, the SD of quiz scores is 5. Which one? Why?
- Is the SD in F greater than, less than, or equal to 1? Why?
- Provide a ballpark estimate of SD in each case.
Example 13.3 This is a simplified example of batch testing1 for a disease. In batch testing, specimens (like blood or saliva samples) from a group of people are pooled together into one batch, which then undergoes one test. If none of the people has the disease, then the batch test result will be negative, and no further tests are required. But if at least one person in the batch has the disease, then the batch test result will be positive, and then each person in the batch must be tested individually. (We’re assuming no false positives and no false negatives for this example.)
Suppose that \(n=8\) people to be tested are split into two groups of 4 people each. Within each group of 4 people, specimens are combined into a batch to be tested. If anyone in the batch has the disease, then the batch test will be positive, and those 4 people will need to be tested individually. Assume that each person has probability \(p=0.1\) of having the disease, independently from person to person. (The assumption of independence might be unreasonable if the people are in close contact with one another.)
Let \(X\) represent the total number of tests that are conducted.
- What are the possible values of \(X\)?
- Find the distribution of \(X\).
- Compute and interpret \(\text{E}(X)\). In what sense is batch testing betting than just testing all 8 individuals initially?
- Compute \(\text{Var}(X)\) and \(\text{SD}(X)\).
Example 13.4 SAT scores have a mean of 1050 and a standard deviation of 200. ACT scores have a mean of 21 and a standard deviation of 5.5. The shape of the distributions of scores is similar for the two tests.
Darius’s score on the SAT is 1500. Alfred’s score on the ACT is 31. We’ll investigate who scored relatively better on their test.
- Compute the deviation from the mean for Darius’s SAT score. How large is this value relative to the standard deviation for SAT scores (which measures, roughly, the average deviation from the mean)?
- Compute the deviation from the mean for Alfred’s ACT score. How large is this value relative to the standard deviation for ACT scores?
- Who scored relatively better on their test? Explain.
- Could we answer the previous question if we did not know that the shapes were similar?
- Standard deviation provides a “ruler” by which we can judge a particular realized value of a random variable relative to the distribution of values.
- If \(X\) is a random variable with expected value \(\text{E}(X)\) and standard deviation \(\text{SD}(X)\), then the standardized random variable is \[ Z = \frac{X - \text{E}(X)}{\text{SD}(X)} \]
- However, keep in mind that comparing standardized values is most appropriate for distributions that have similar shapes.
- Standardization is most natural for random variables that follow a Normal distribution.
- A Normal distribution has two parameters: its mean (typically denoted \(\mu\)) and its standard deviation (typically denoted \(\sigma\)).
- For Normal distributions the probability that a value is within (or beyond) a given number of standard deviations from the mean follows a specific pattern called the “empirical rule”. For example:
- 50% of values are within 0.67 standard deviations of the mean
- 68% of values are within 1 standard deviation of the mean
- 95% of values are within 2 standard deviations of the mean
- 99.7% of values are within 3 standard deviations of the mean
- We will study Normal distributions in much more detail later
Thanks to Allan Rossman for this example. His blog has more investigations into batch testing, including what happens as \(n\) and \(p\) change. Cal Poly implemented versions of batch testing for COVID through saliva samples and wastewater testing.↩︎